Analytics
The Analytics section provides insights into how visitors interact with your verses and activations. This helps you understand your audience, track engagement, and optimize your activations. You can filter data by time ranges such as Last 7 Days, Last 30 Days, Last 3 Months, Last Year, or Custom.
Overview
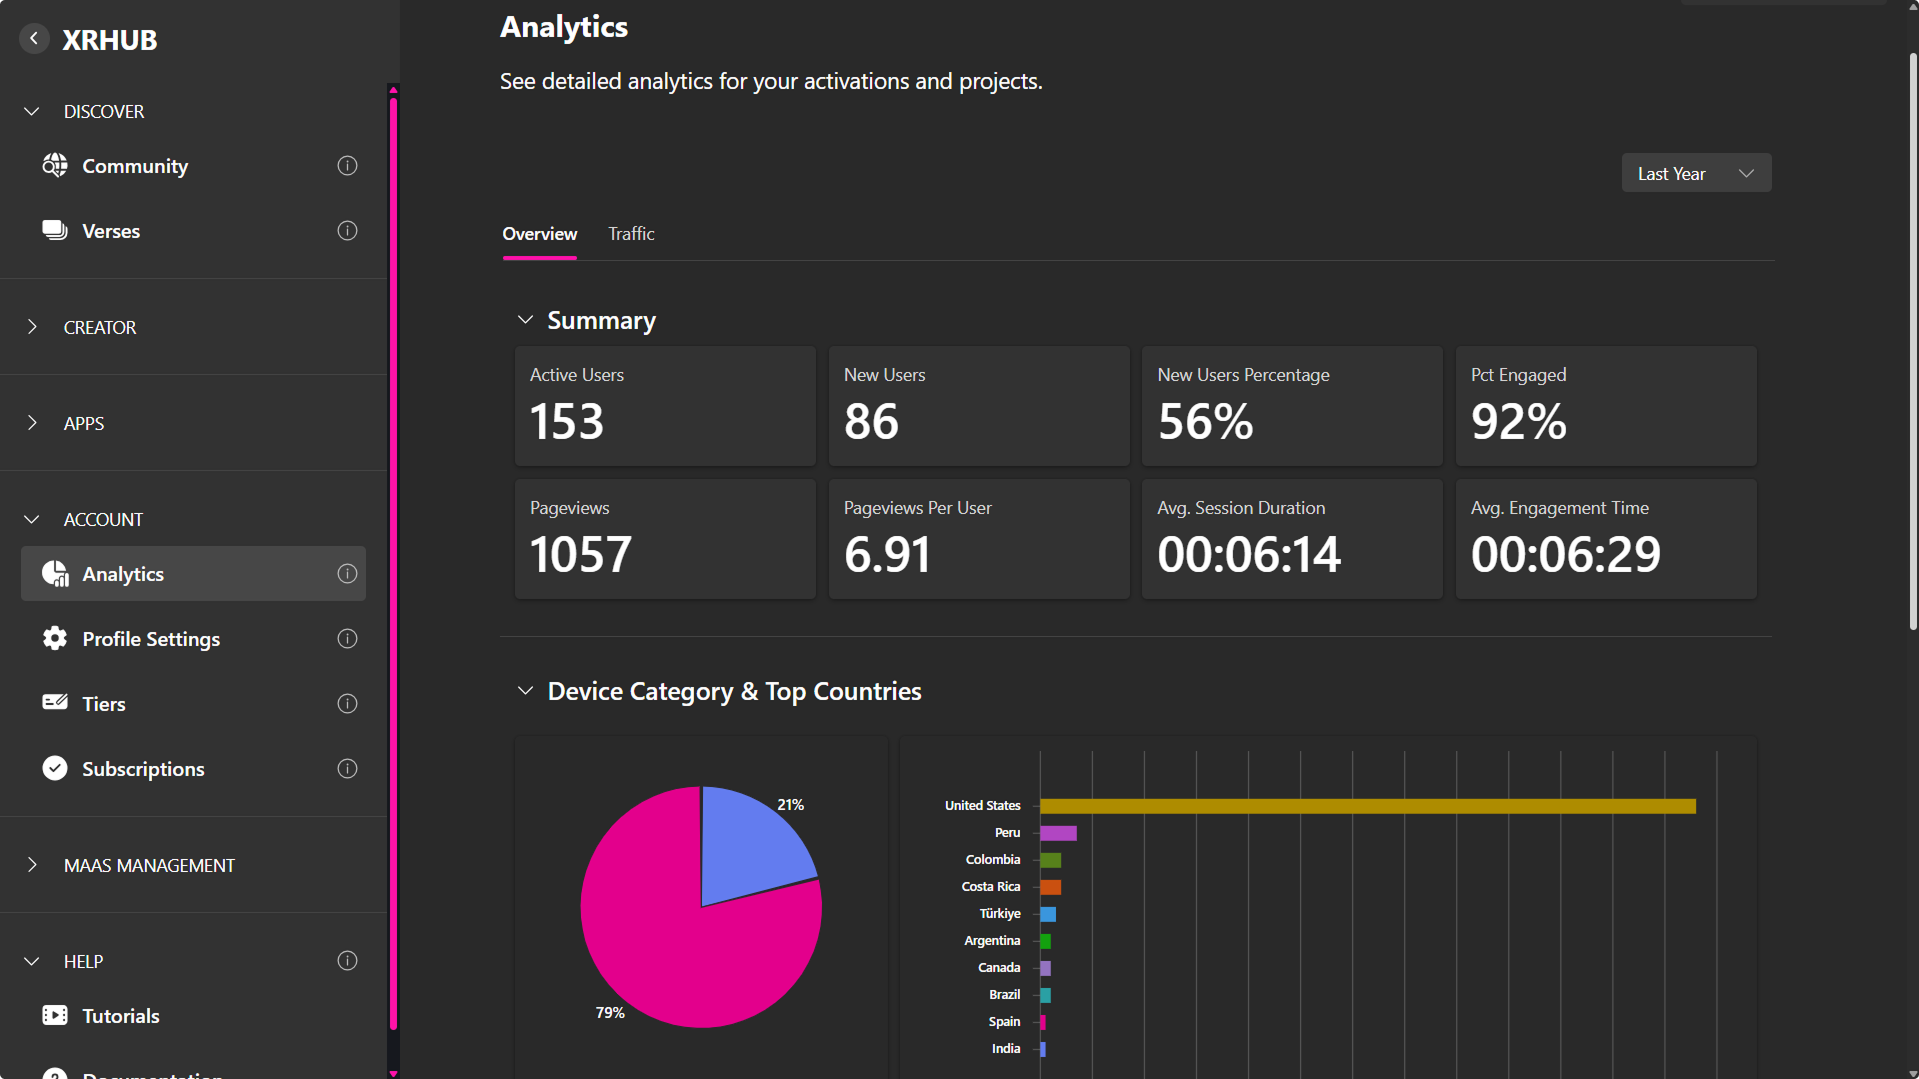
Summary
- Active Users – The total number of users who interacted with your verse during the selected time range.
- New Users – How many of those users are visiting for the first time.
- New Users Percentage – The proportion of new visitors compared to returning ones.
- Pct Engaged – The percentage of users who actively engaged (e.g., clicked, scrolled, interacted) rather than just viewing.
- Pageviews – Total number of times your verse pages were viewed.
- Pageviews Per User – Average number of pages viewed per visitor.
- Avg. Session Duration – Average length of time users spent in your verse during a single visit.
- Avg. Engagement Time – Average time users spent actively interacting with your verse content.
Device Category & Top Countries
- Device Category – Breakdown of visits by Mobile vs Desktop usage.
- Top Countries – Geographic distribution of where your users are connecting from.
Operating System & Browser
See which operating systems (Windows, Mac, Android, iOS) and browsers (Chrome, Edge, Safari, etc.) your audience is using. This helps in optimizing the experience for your main user base.
Traffic
Traffic Sources
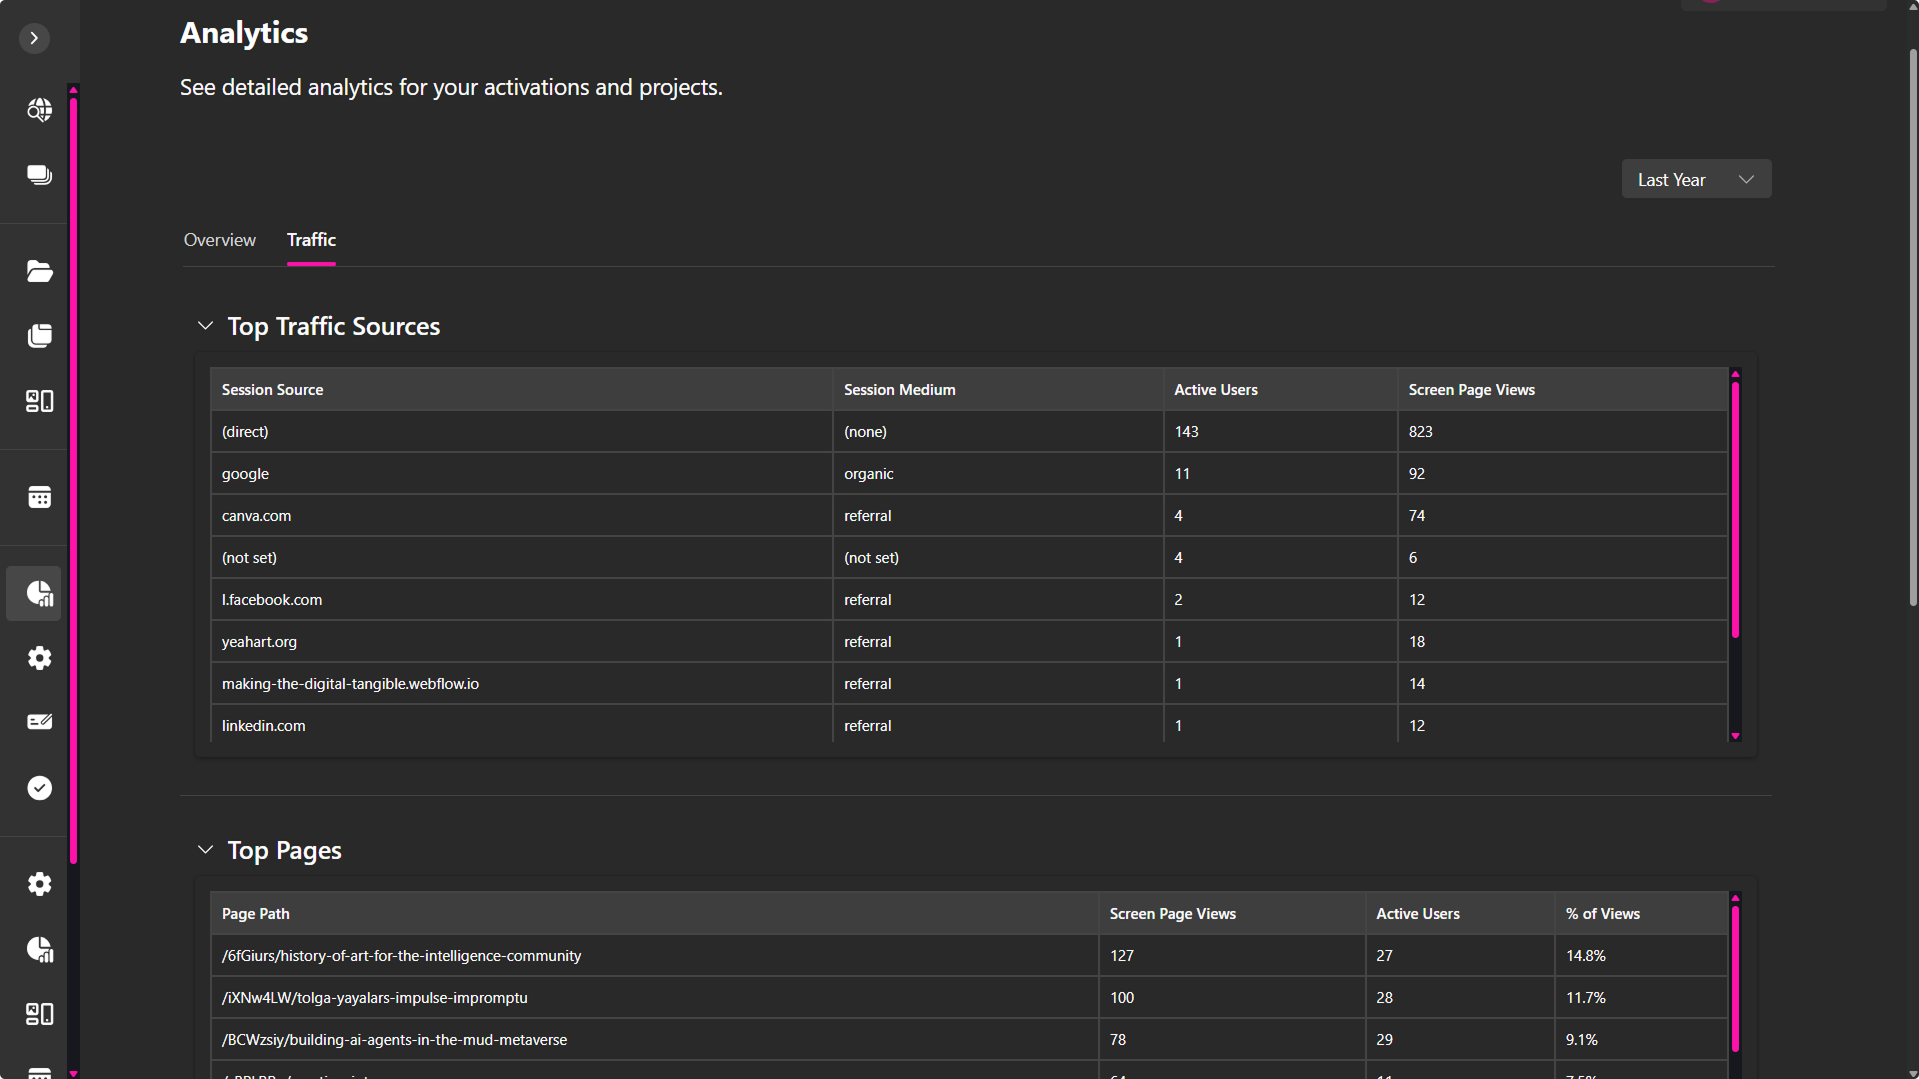
Understand how visitors arrive at your verse:
- Direct – Users entered the link directly.
- Organic – Found your verse through search engines like Google.
- Referral – Arrived via links from other websites or emails.
- Social / Campaigns – If tracked, shows traffic from specific promotions or platforms.
Top Pages
Lists the most visited pages in your verse, showing:
- Page Path – The URL of the visited page.
- Screen Page Views – Number of times the page was viewed.
- Active Users – Unique users who visited that page.
- % of Views – Proportion of traffic each page represents.
Top Events
Tracks user actions within your verse:
- page_view – Every time a page loads.
- scroll – When users scroll through your content.
- user_engagement – General interaction activations.
- session_start – When a user begins a session.
- click – When users click on buttons or links.
- first_visit – Logged when someone enters for the first time.
- form_start – When a form (e.g., RSVP or registration) is initiated.
This data ensures you always know how your audience is interacting with your content, allowing you to improve user experience and measure the success of your activations.