Analytics
The Analytics section provides administrators with key performance indicators (KPIs) for the platform, helping administrators evaluate user engagement, session behavior, and growth trends.
It includes visual data representations such as charts, tables, and summaries that cover user activity, traffic sources, top pages, events, and system usage.
The page is divided into two main tabs:
- Overview – Displays user statistics, session data, and platform usage by device and country.
- Traffic – Shows detailed breakdowns of page views, events, and top sources of traffic.
A date filter (e.g., Last 7 Days) allows you to adjust the reporting window for more precise analytics.
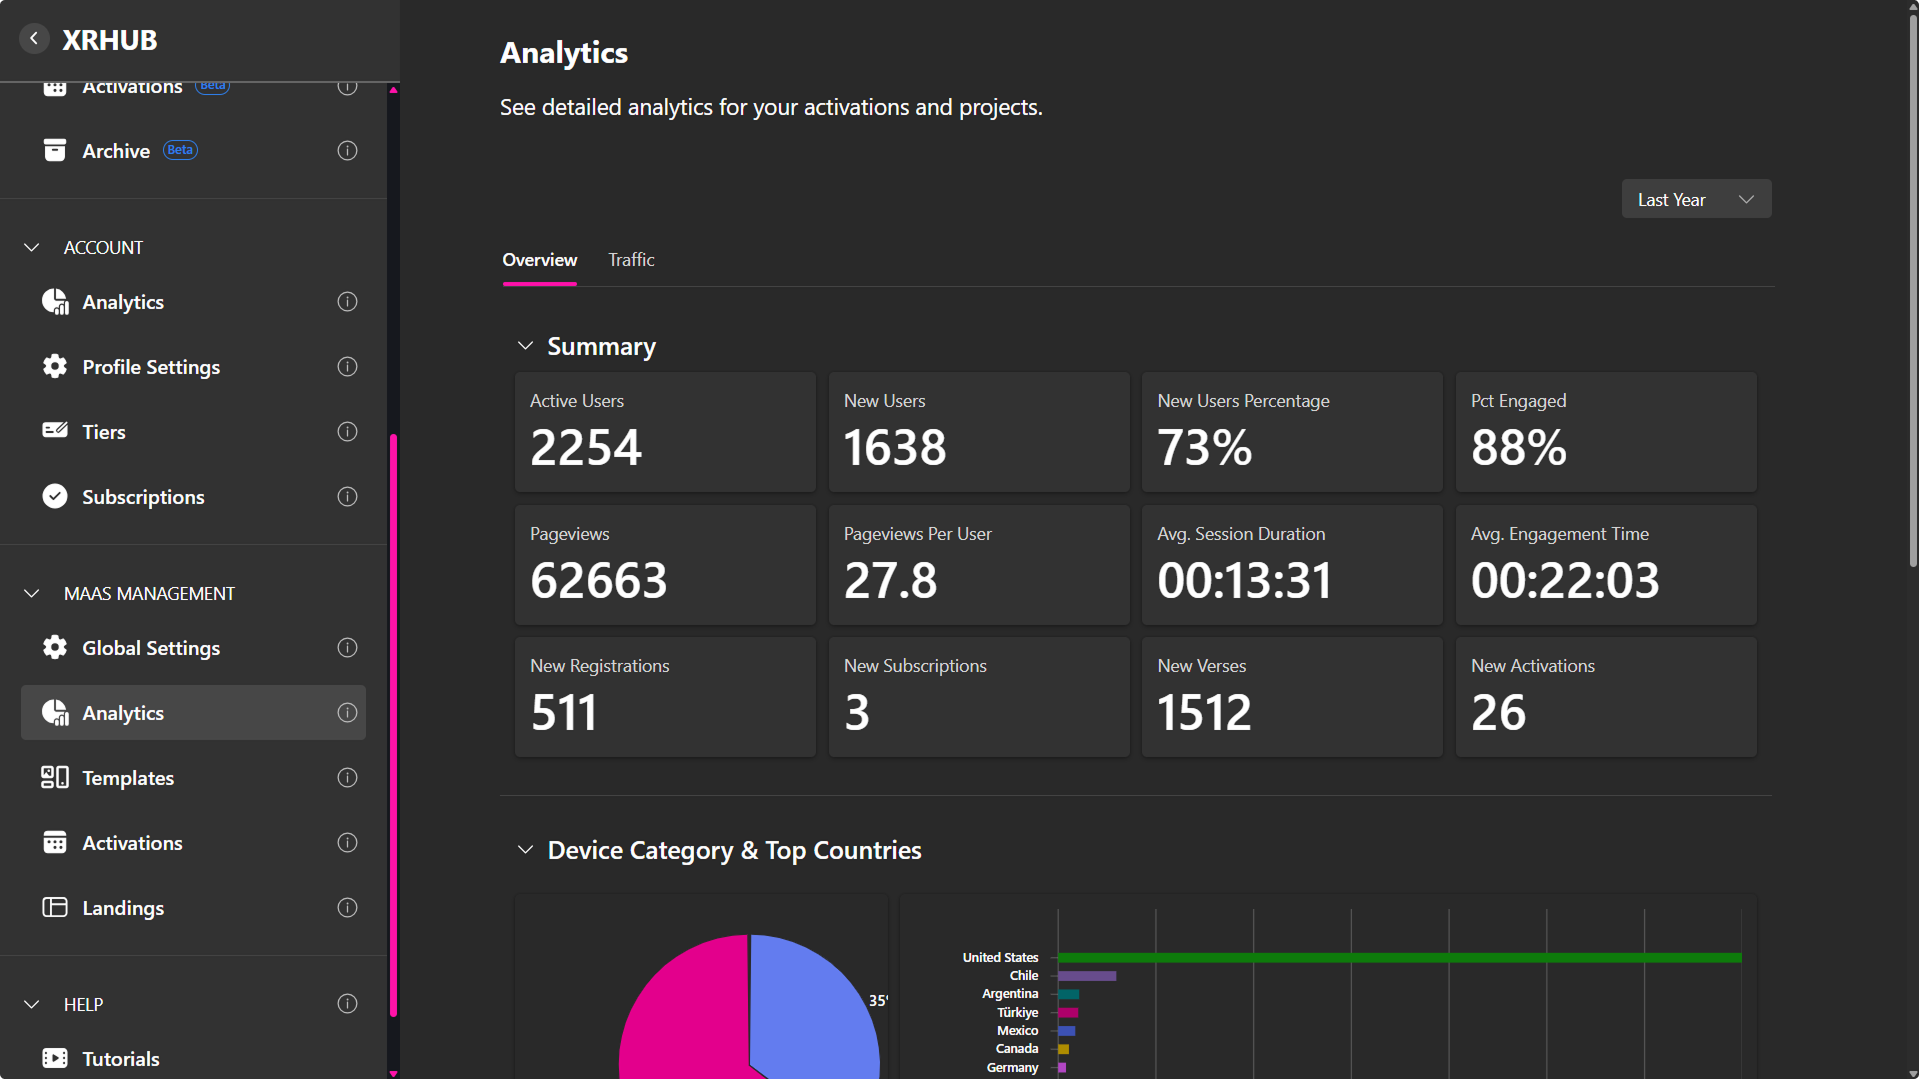
Overview Tab
The Overview tab summarizes key metrics that reflect platform performance and user engagement.
Summary
Displays quick statistics about activity across the platform, including:
| Metric | Description |
|---|---|
| Active Users | Number of users currently active within the selected timeframe. |
| New Users | Total new users who joined during the reporting period. |
| New Users Percentage | Percentage growth compared to existing user base. |
| Pct Engaged | Overall engagement percentage across the platform. |
| Pageviews | Total number of page views recorded. |
| Pageviews Per User | Average number of page views per user. |
| Avg. Session Duration | Average time spent per user session. |
| Avg. Engagement Time | Average time users actively interacted with the platform. |
| New Registrations | Number of newly registered accounts. |
| New Subscriptions | Count of new subscription activations. |
| New Verses | Number of new metaverse spaces or environments created. |
| New Activations | Count of new activations launched within the period. |
Device Category & Top Countries
Two visual charts display user distribution:
- Device Category – Breaks down usage by device type (e.g., Desktop, Mobile).
- Top Countries – Highlights where most user activity originates geographically.
Operating System & Browser
These bar charts show which operating systems and browsers users are utilizing to access the platform, offering valuable insights for optimization and compatibility.
Traffic Tab
The Traffic tab provides detailed data about user journeys, traffic sources, and content performance.
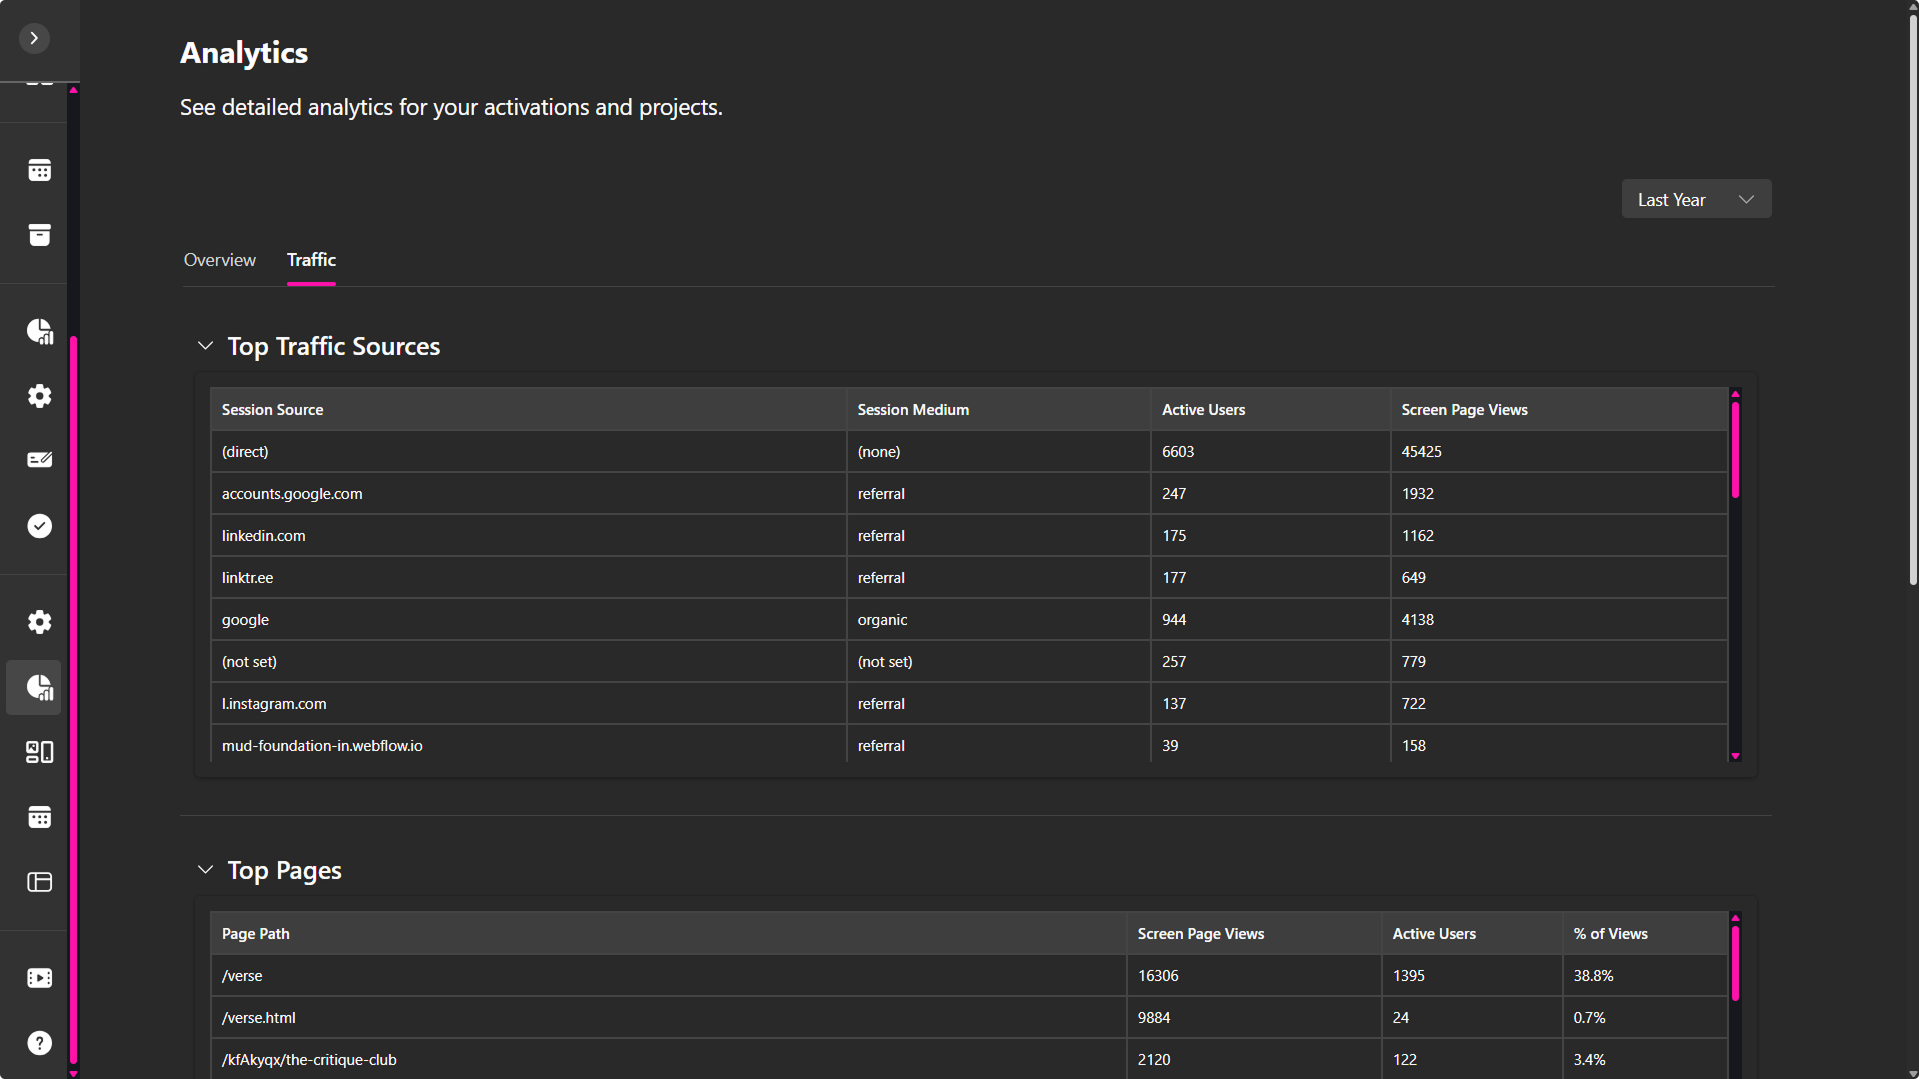
Top Traffic Sources
Lists the most common entry points for users, including direct visits, referrals, and account-based access.
Each entry displays:
| Column | Description |
|---|---|
| Session Source | The origin of the user’s visit (e.g., direct, referral, or domain). |
| Session Medium | The method through which users arrived (e.g., referral link or none). |
| Active Users | Number of users from that source. |
| Screen Page Views | Total number of page views generated by that traffic source. |
Top Pages
Displays the most visited pages or spaces across the platform.
| Column | Description |
|---|---|
| Page Path | The specific URL or internal route of the page. |
| Screen Page Views | Number of views recorded for the page. |
| Active Users | Total active users who visited the page. |
| % of Views | Percentage of total views represented by that page. |
Top Events
Lists the most frequent user interactions tracked within the system.
| Column | Description |
|---|---|
| Event Name | The name of the tracked event (e.g., page_view, scroll, session_start). |
| Event Count | Total number of times the event occurred. |
| % Events | The percentage this event represents among all tracked events. |
| Event Count Per User | The average number of times each user triggered the event. |
Data Visualization
The Analytics dashboard includes multiple interactive visualizations, such as:
- Pie Charts – For device and geographic distribution.
- Bar Charts – For operating systems, browsers, and engagement patterns.
- Tables – For traffic, events, and content performance metrics.
These visualizations make it easy to identify high-performing areas and track user behavior trends at a glance.
Notes
- Analytics update automatically based on platform activity.
- The Traffic tab is useful for content optimization and engagement tracking.
- The Overview tab provides a high-level view of platform health.
- All data reflects aggregated user behavior within the selected date range.
- Use these insights to improve user experience, engagement, and performance across the XR ecosystem.